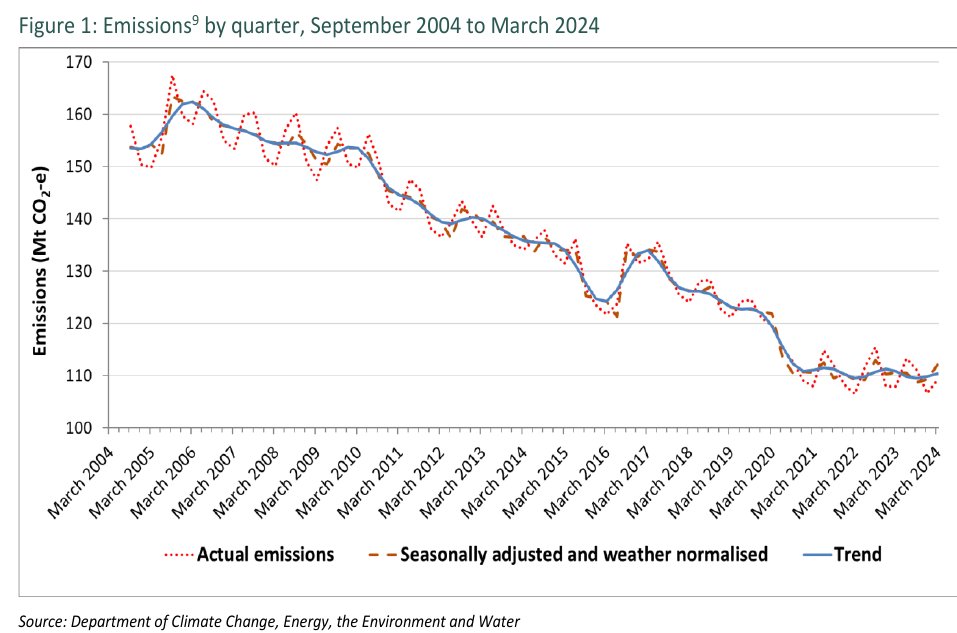
Friday afternoon the Federal government released the latest quarterly greenhouse gas emissions data that showed national emission levels increased 0.6% (0.6 MtCO2-e) in seasonally adjusted trend terms. Some would say the timing of this data release is ‘putting out the trash’..
The graph of total emissions shows emissions have been flatlining for the last three years. This is a problem in policy implementation beyond the present Labor Government. But the Labor policy to keep expanding gas is making domestic emissions worse (as well as global emissions), while a number of policies slowly being implemented may see emissions reductuion in future years.
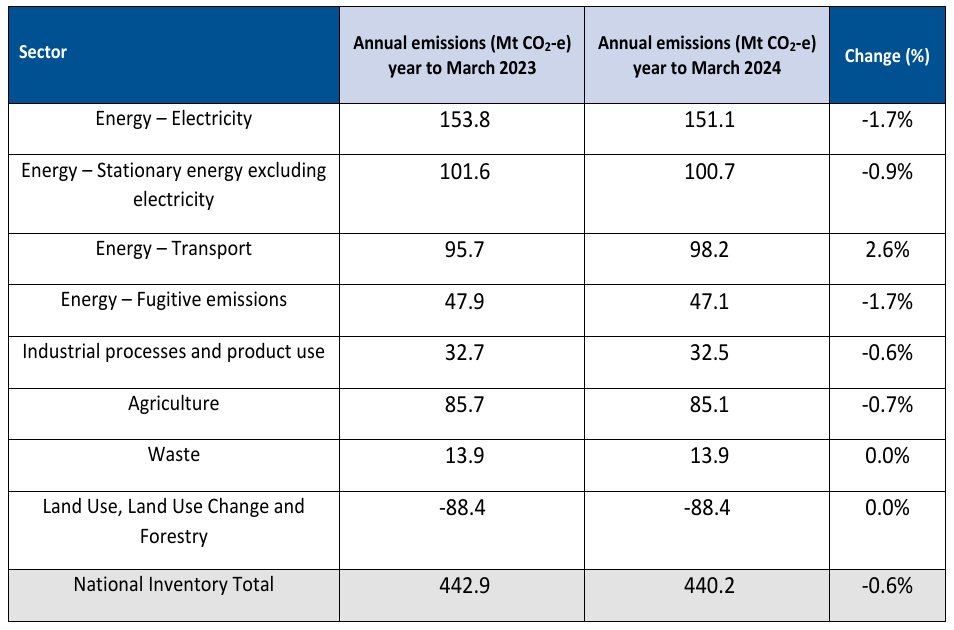
Transport emissions have continued to rise in the quarter partially countering a decline in electricity sector emissions due to the transition to renewables. Transport emissions are now at a similar level as before the pandemic in 2019. This is partly driven by demand for larger vehicles due to motor vehicle advertising, and to increases in aviation back to pre-pandemic levels.
Long Term sectorial trends
From the Quarterly Update of Australia’s National Greenhouse Gas Inventory: March 2024:

Land Use, Land Use Change and Forestry (LULUCF) – where emissions have decreased by the largest margin of any sector since June 2005 (217.9% or 163.3 Mt CO2-e) due to reductions in land clearing and native forest harvesting, increases in plantations and native vegetation, and improvements in soil carbon on agricultural lands;
Electricity – where emissions have decreased 23.2% or 45.6 Mt CO2-e since June 2005. After decades of strong growth, emissions peaked in 2009 and have steadily fallen since. This primarily reflects accelerating renewables deployment and the ongoing displacement of coal and, to a lesser extent, gas as fuel sources;
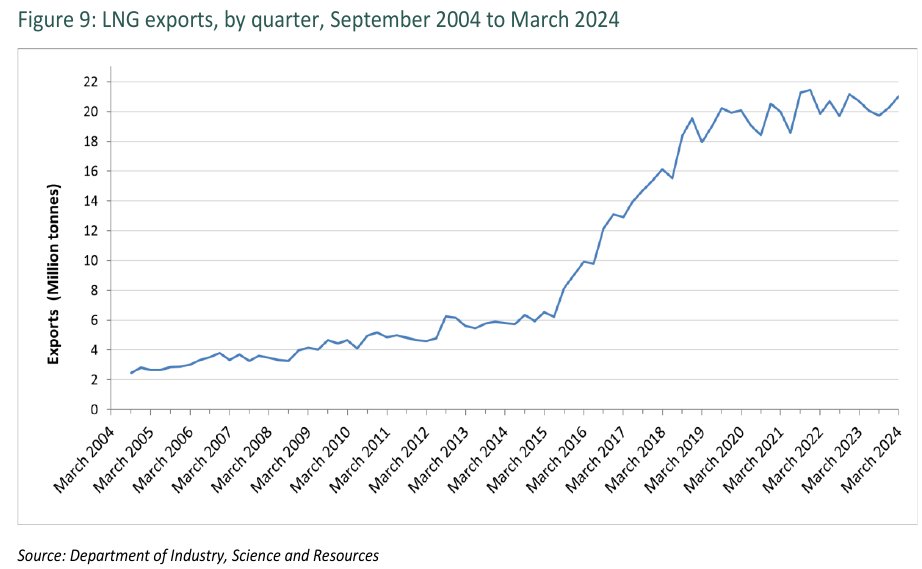
Stationary energy (excluding electricity) – which has experienced the largest growth of any sector since June 2005. Emissions have increased 22.4% or 18.4 Mt CO2-e driven, in particular, by continued growth in the production and export of LNG;
Transport – where emissions have increased 19.7% or 16.2 Mt CO2-e since June 2005, despite recent volatility due to the impacts of the COVID pandemic;
Fugitives – where emissions have increased 10.0% or 4.3 Mt CO2-e since June 2005. Emissions increased from 2015 due to growth of the LNG export industry. Since 2019 emissions have moderated substantially, reflecting stabilising flaring activity at LNG facilities and declining emissions from underground mining; and
Agriculture – where emissions have declined by 4.3% or 3.8 Mt CO2-e since June 2005, in line with declining livestock populations.
Notes
Note 1 Land Use Land Use Change and Forestry: Many countries do not include Land Use Land Use Change and Forestry data in national reporting due to the complexities in carbon accounting and differentiating emissions reduction from natural carbon cycles. Australia has for decades relied on rubbery reduced land clearing and vegetation land sink as part of LULUCF to argue we have reduced emissions. This is dodgy carbon accounting. If you exclude LULUCF draw down, Australia’s emissions have been fairly static. The only progress we are making is in electricity energy transition and this progress is offset by increasing transport emissions, stationary energy (LNG processing) and fugitive emissions.
Note 2 Stationary Energy Emissions: A large part of stationary energy emissions are the energy for processing gas to LNG for export. Every new LNG plant built increases domestic emissions, even without consideration of the fugitive emissions in transporting LNG and the emissions when burnt. The Australian Government provision of $1.5 billion to the Darwin Middlearm development is a subsidy for a new LNG Plant that will increase Australia’s Stationary and Fugitive emissions.
Note 3 Transport Emissions: One of the issues in transport has been the motor vehicle companies promoting SUVs and luxury monster utes which increase vehicle emissions and reduce road safety and add to a growing road death toll. The New Vehicle Efficiency Scheme may assist in partly reversing this, but the Government needs to also consider closing the Luxury Ute tax loophole that costs the taxpayer $250 million in 2023. A Fossil Ad Ban would also be useful in changing demand for these vehicles. We highlighted both of these actions in our Net Zero Transport Consultation Roadmap submission
Note 4 Fugitive Emissions: There are fugitive emissions from coal and gas extraction, pipelines, distribution network to where it is burnt in houses and factories. Coal and gas mining continues to use state average estimates of fugitive emissions which are widely inaccurate in under-estimating coal and gas emissions when compared to satelite measurements. The Climate Minister has only recently taken action to address this inaccurate measurement methodology that feeds in to Fugitive emissions data. The fugitives data in this quarterly report is likely an underestimate.
Note 5 Agricultural emissions: The millenial drought caused livestock populations to decrease which has reduced agricultural emissions. Supplements for stock feed (such as red seaweed) will assist in reducing ruminant methane emissions. Change in dietary habits is also to be encouraged to reduce eating meat and encourage a more plant based diet, will reduce herd size and emissions.
The other aspect is use of synthetic fertiliser – Urea – which is fossil fuel based process using fossil gas. We need to ramp up renewable hydrogen production for Urea production to replace methane in the production process. This should be a priority use of renewable hydrogen. See Nitrogen Fertilizer Urea production Locking in Fossil Fuels greenhouse gas emissions for industrial Food production (Oct 22, 2022)
Comparing Year to March 2024 with revious year
We are yet to see data from the Safeguard mechanism which mandates emission reduction (or purchase of carbon credits for carbon offsets) from Australia’s top greenhouse gas polluters.
References:
Chris Bowen, media release, 30 August 2024, Australia’s overall emissions continue to decrease under the Albanese Government https://minister.dcceew.gov.au/bowen/media-releases/australias-overall-emissions-continue-decrease-under-albanese-government
DCCEEW, 30 August 2024, National Greenhouse Gas Inventory Quarterly Update: March 2024 https://www.dcceew.gov.au/climate-change/publications/national-greenhouse-gas-inventory-quarterly-update-march-2024#dcceew-main
The Guardian, 22 July 2024, Luxury ute tax loophole costs Australians $250m a year, researchers say https://www.theguardian.com/australia-news/article/2024/jul/22/luxury-ute-tax-loophole-emissions-reductions-evs-taxpayers
John Englart, Climate Citizen, 7 October 2022, Nitrogen Fertilizer Urea production Locking in Fossil Fuels greenhouse gas emissions for industrial Food production https://takvera.blogspot.com/2022/10/nitrogen-fertilizer-urea-production.html

[…] 30 August 2024 – Friday afternoon Department of Climate Change releases the latest data: March 2024 quarter greenhouse gas emissions. A 0.6% increase in emissions, seasonally adjuasted, for the quarter with emissions reduction flatlining for the last 3 years. (Climate Action Merribek) […]
LikeLike