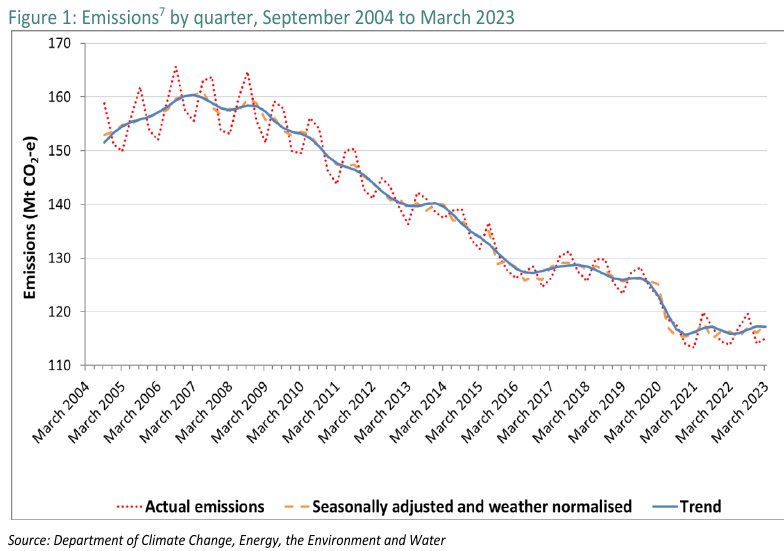
The latest quarterly emissions reduction report, to March 2023, was released on Friday. The news is mixed. Total Emissions are currently flatlining, not reducing. While some sectors are seeing emissions reduction (Electricity, LULUCF), other sectors are showing emissions increasing (Stationary Energy, Transport, Fugitive emissions).
Emissions for the year to March 2023 are estimated to be 465.9 Mt CO2 -e. This is relatively flat compared with the previous year, with emissions estimated to be up by 0.1% (0.3 Mt CO2-e). The emissions trend over the year to March reflects annual increases in emissions from the transport, agriculture, and waste sectors. These increases were partially offset by decreases in the electricity, stationary energy (excluding electricity), fugitive emissions and industrial processes sectors.
Over the year to March 2023 the 3.9% decrease in emissions from the electricity sector reflected a decrease of 4.7% in coal generation and an increase of 18.6% in renewable generation in the National Electricity Market (NEM). This decreasing trend was partially offset by a 7.1%8 increase in gas generation in the NEM.
Quarterly update to Australia’s Greenhouse Gas inventory to March 2023
Transport emissions increased 6.4% over the year to March 2023, reflecting a return towards pre-COVID levels of transport activity after the widespread COVID related restrictions on movement in the 2021 and 2022 financial years.
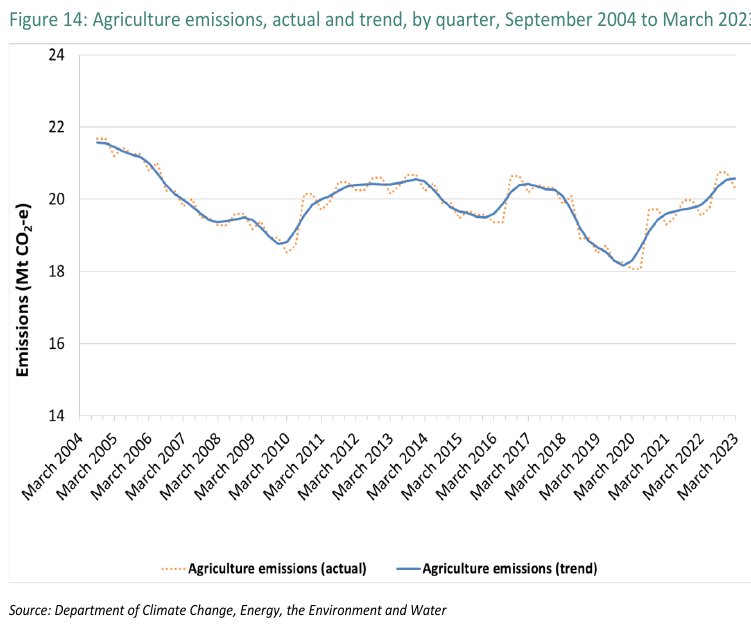
Emissions from the agriculture sector increased 3.2% to 81.6 Mt CO2-e, returning to pre-drought levels, reflecting a continuation of the recent changes in rainfall, cropping and livestock populations.
In terms of long term trends this quarterly update identifies two good news stories:
- Land Use, Land Use Change and Forestry (LULUCF) – where emissions have decreased by the largest margin of any sector since June 2005 (179.1% or 144.6 Mt CO2-e) due to reductions in land clearing and native forest harvesting, increases in plantations and native vegetation, and improvements in soil carbon;
- Electricity – where emissions have decreased 22.2% or 43.7 Mt CO2-e since June 2005. After decades of strong growth, emissions peaked in 2009 and have since fallen 27.7%. This primarily reflects accelerating renewables deployment and gradual displacement of coal as a \ fuel source;
…and three bad news stories:
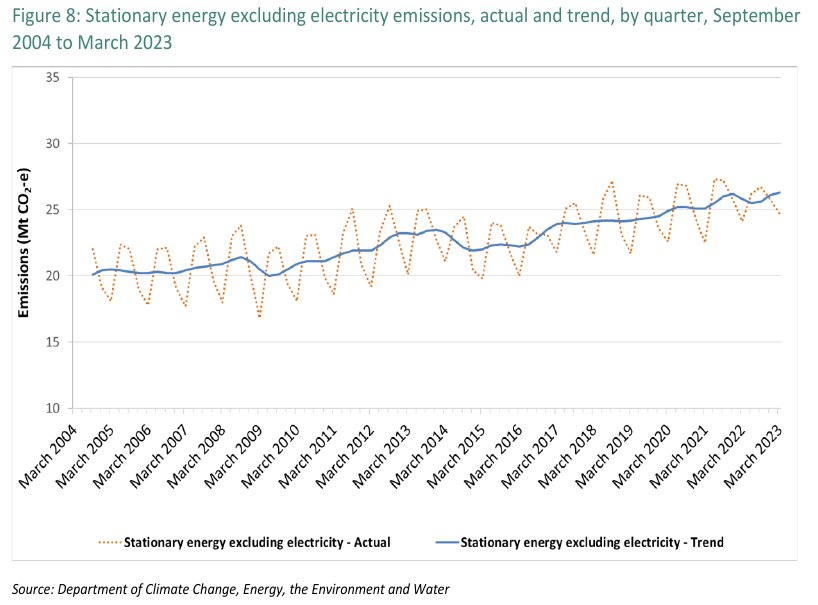
- Stationary energy (excluding electricity) – which has experienced the largest growth of any sector since June 2005. Emissions have increased 26.7% or 21.8 Mt CO2-e driven, in
particular, by continued growth in the production and export of LNG; - Transport – where emissions have increased 18.0% or 14.9 Mt CO2-e since June 2005, despite recent volatility due to the impacts of the COVID pandemic;
- Fugitives – where emissions have increased 12.8% or 5.5 Mt CO2-e since June 2005.
Emissions were relatively stable until 2015, but have increased as a result of the growth of
the LNG export industry;
For agriculture, emissions have declined in the l9ong term due to reduced livestock herd. These emissions also fluctuate with the water cycle and drought conditions and agricultural productivity.
Insights
It is clear transition in the electricity sector already under way, needs to be further ramped up through more investment in renewables and grid storage, and in building the transmission network. Gas fills a short term peaking role, but is expensive. The closure of coal power stations needs to be brought forward as new renewables and grid storage comes on line.
Recent decisions by the Western Australian and Victorian Governments to stop logging of native forests will increase the carbon sink capacity and emissions in the Land Use, Land Use Change and Forestry (LULUCF) sector, although we still need better regulation of land clearing in some jurisdictions.
Stationary Energy – LNG export driving emissions increase
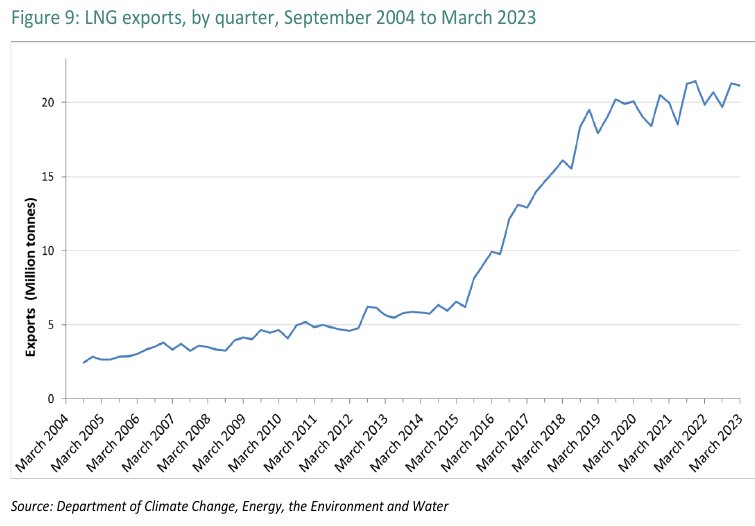
The report highlights that “An important driver of emissions trends in stationary energy over the last 8 years has been the production of LNG for export. Figure 9 shows that LNG exports have increased by 231% compared to the year to June 2015, before the start of the rapid ramp-up.”
Why then is the Federal Government providing a $1.5 billion subsidy for the Darwin Middlearm Hub which provides an impetus for fracking the Beetaloo Basin and Barossa Project with the establishment of a further LNG export terminal and petrochemical plant? This will again add to Australia’s stationary energy sector emissions, and fugitive emission sectors.
Transport Emissions – Recovering fast from pandemic reduction
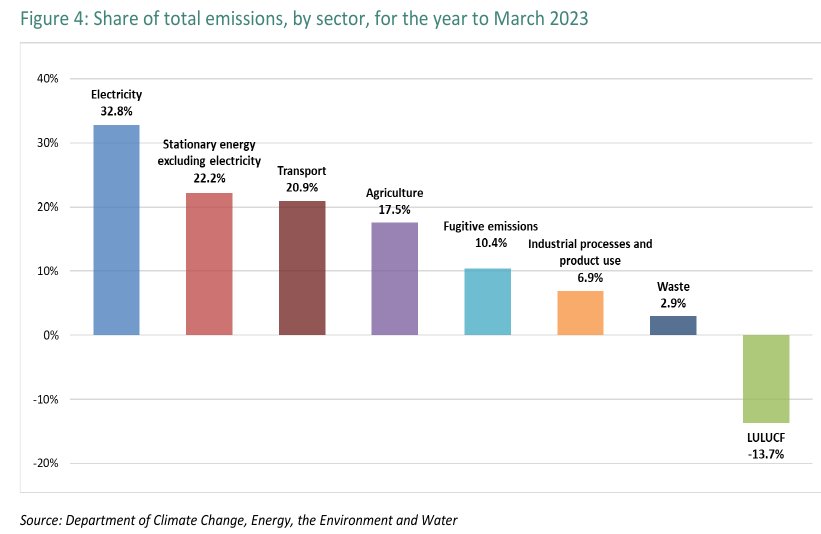
This covers road, rail, domestic aviation and domestic shipping. The main fuels used for transport are automotive gasoline (petrol), diesel oil, liquefied petroleum gas (LPG) and aviation turbine fuel (jet fuel). In the year to March 2023, transport accounted for 20.9% of Australia’s national inventory.
Emissions from transport over the year to March 2023:
- increased 6.4% in actual terms, compared with the previous year
- Increase driven by a 63.4% increase in emissions from domestic jet fuel consumption, a 5.0% increase in emissions from road petrol consumption and 1.4% increase in emissions from road diesel consumption over the year to March 2023
- overall transport sector emissions remain 3.6% below the levels observed in the year to December 2019
- emissions from the domestic aviation sector continued sharp rise since the lows of the COVID pandemic. Now at highest quarterly level since peak in December 2017 quarter.
- strong increase in diesel consumption since 2009. Underlying reasons include the population driven increase in the road transport fleet, increasing popularity of diesel vehicle options for passenger vehicles and increasing demand for freight which is dominated by diesel-powered light commercial and heavy vehicles.
This underlines the importance of an ambitious Fuel Efficiency standards to drive the importation of more Electric Vehicles into the market. There also need for regulatory action regarding automobile manufacturers pushing larger (heavier) vehicles which is creating more resource use, more greenhouse gas pollution emissions , and reducing safety of vulnerable road users.
The increase in Diesel particulates are particularly concerning for human pollution and human health.
Aviation emissions are particularly difficult to decarbonise. Climate Action Merribek believes demand management measures are needed to regulate emissions from this sector, both for domestic and international aviation emissions. Airports should not be expanded to induce extra aviation demand. This includes opposing Melbourne airport 3rd runway development project. See our Campaign page on Aviation emissions
Agriculture Emissions on rebound with La Nina conditions
Emissions in the agricultural sector are on the rebound due to good crop productivity associated with La Nina conditions over the last 3 years. The Livestock herd is also on the increase. Emissions from crop residues and fertiliser use with favourable farming conditions brought record crop production in 2021-22.
Conclusion
It is clear from this National Greenhouse Gas Inventory quarterly report that actions to ramp up emissions reduction are needed. The Transition in the electricity sector needs to mainatain momentum and even increase. The Federal Government should cancel the subsidy to the Darwin MiddleArm Petrochemical hub as a project that will drive increasing emissions, cancel fossil fuel exploration including off Victoria’s coast, and major work is needed in reversing transport sector emissions.
References:
DCCEEW, 25 August 2023, National Greenhouse Gas Inventory Quarterly Update: March 2023, https://www.dcceew.gov.au/climate-change/publications/national-greenhouse-gas-inventory-quarterly-update-march-2023
