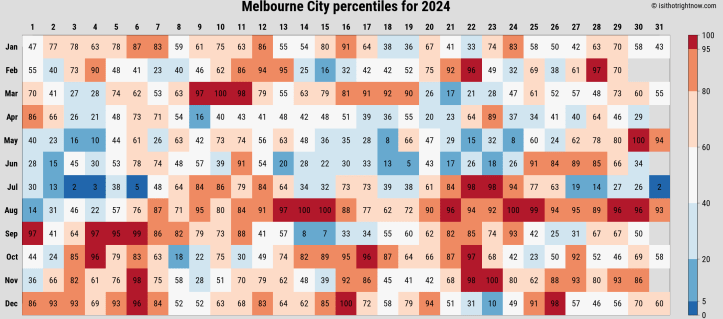
Our summers are getting warmer, and on average we are experiencing more extreme heat days over 35C and 40C, and warmer nights over 20C and 25C. This is due to increasing climate pollution with green house gases causing global temperatures to rise.
According to the European Copernicus climate assessment, 2024 was the hottest year on record globally from a dataset that goes back to 1850. It was 1.60°C warmer than the pre-industrial level, making it the first calendar year to exceed 1.5°C above that level.
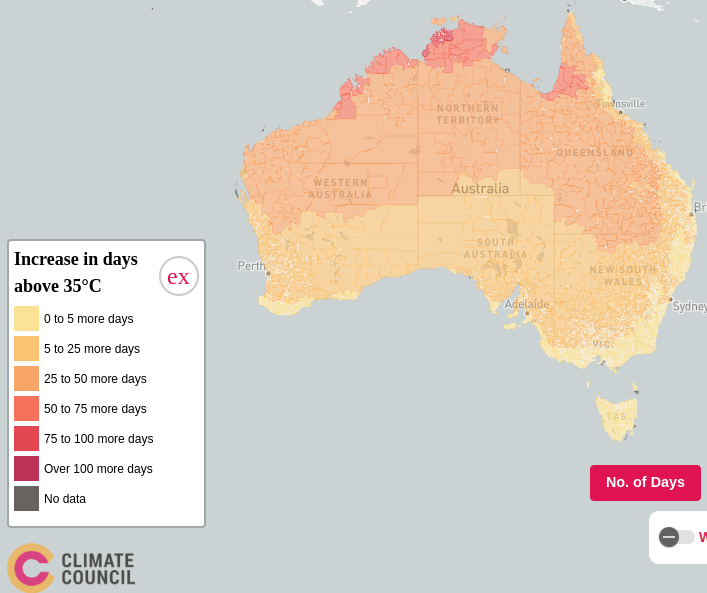
Here in Merri-bek the number of Hot days is projected to increase by 5 days to 13 days above 35°C by 2050. We get off lightly. Darwin is expecting 139 days above 35°C by 2050, an increase of 92 days.
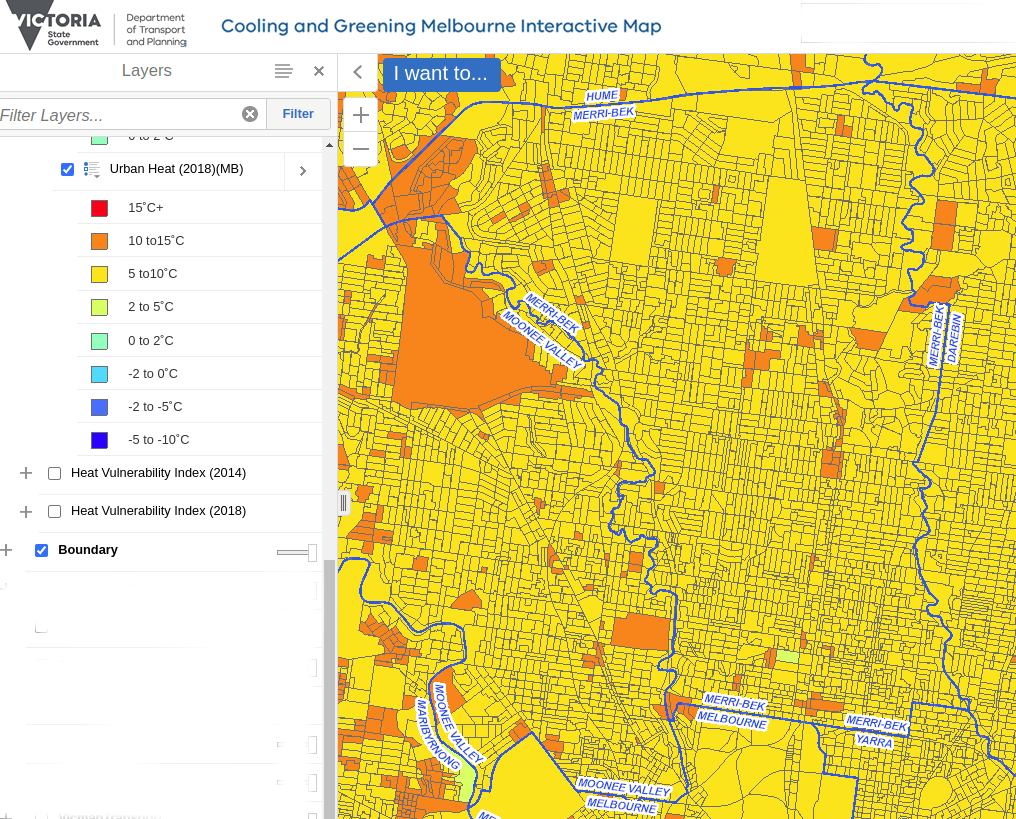
In the city we also have rising temperatures amplifying the Urban Heat Island Effect. This is where the built infrastructure and paved surfaces heat up during the day and keep the nights warmer. For large cities like Melbourne the Urban heat can be 5-15C warmer than a nearby country area. Urban heat will differ in parts of the city according to how many parks and trees, space given for asphalt roadways, urban water features, dark roofs and green roofs, cool pavements.
According to Planning Department data in 2014 the southern suburbs of Brunswick, East Brunswick, Brunswick West, Coburg and Pascoe Vale South were all in the 2-5C UHI temperature range. The northern suburbs of Fawkner, Coburg North, Hadfield, Pascoe Vale, Glenroy, Oak Park and Gowenbrae were in the 5-10C range. Four years later in 2018 all of Merri-bek has 5-10C urban heat island temperatures, while several small pockets are in the 10-15C range. Urban heat is particularly prominent in the Upfield Corridor in Brunswick and Coburg, and in the industrial areas around the municipality.
There has been no more recent update to this planning tool, although we did suggest new data should be added in our submission to the Parliamentary Inquiry into Climate Resilience.
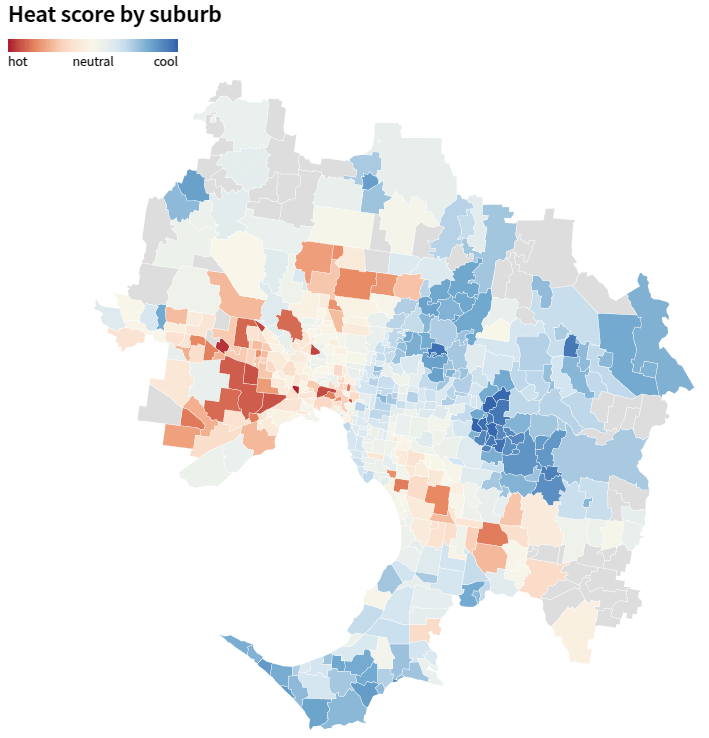
RMIT and Melbourne University Researchers in early 2024 analysed and provided maps for Melbourne based on a heat score for buildings and Heat score by suburb.
Victoria temperature anomaly trend based on 1961-1990 climatology:
- Annual Mean temperature trend for 1910-2024 is 0.11 C per decade
- Annual Maximum temperature trend for 1910-2024 is 0.1 C per decade
- Annual Minimum temperature trend for 1910-2024 is 0.12 C per decade
- February Mean temperature trend for 1910-2024 is 0.12 C per decade
- February Maximum temperature trend for 1910-2024 is 0.1 C per decade
- February Minimum temperature trend for 1910-2024 is 0.14 C per decade
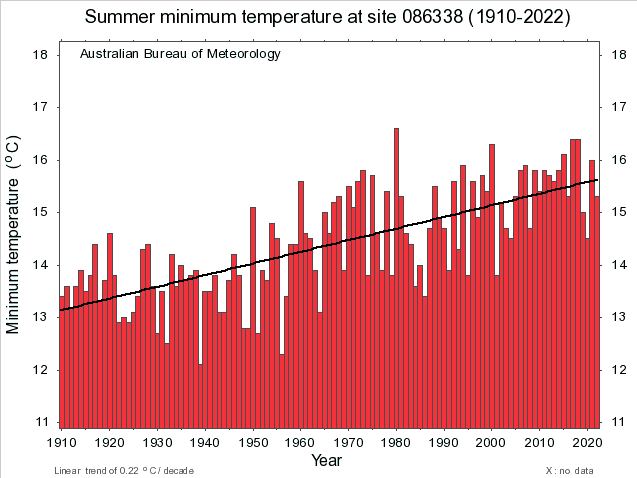
Melbourne (Olympic Park) temperature anomaly trend based on 1961-1990 climatology:
- Summer Mean Temperature Anomaly 1910-2022 is 0.14C per decade
- Summer Maximum Temperature Anomaly 1910-2022 is 0.14C per decade
- Summer Minimum Temperature Anomaly 1910-2022 is 0.22C per decade
As you can see from this Night time temperatures are rising much faster than Mean and Maximum temperatures. While this is true to a minimal extent for Victorian averages, it is pronounced for Melbourne. The Urban heat island effect is responsible for this amplified by general rising temperatures. The Urban heat island effect is most pronounced with night time temperatures.
Merribek – Hot days
In 2050 if we continue the existing action to tackle climate change, there will be in Fawkner, Glenroy, Pascoe Vale, Hadfield, Gowenbrae:
- 13 days above 35°C. This is an increase of 5 days.
- 2 days above 40°C. This is an increase of 1 days.
- 0 nights above 25°C. This is an increase of 0 nights.
The increase in days is compared to the average over the period of 1986-2005.
Climate Mitigation Pathway:
- No action: 6 more days over 35°C
- Existing action: 5 more days over 35°C
- Necessary action: 4 more days over 35°C
For Coburg, Coburg North, Brunswick, East Brunswick and Brunswick West the trend is the same except for 1 hot night above 25C
- 13 days above 35°C. This is an increase of 5 days.
- 2 days above 40°C. This is an increase of 1 days.
- 1 nights above 25°C. This is an increase of 0 nights.
Climate Mitigation Pathway:
- No action: 6 more days over 35°C
- Existing action: 5 more days over 35°C
- Necessary action: 4 more days over 35°C
Darwin – Hot Days
In 2050 if we continue the existing action to tackle climate change, there will be In Darwin:
- 139 days above 35°C. This is an increase of 92 days.
- 0 days above 40°C. This is an increase of 0 days.
- 195 nights above 25°C. This is an increase of 87 nights.
The increase in days is compared to the average over the period of 1986-2005.
Climate Mitigation Pathways:
- No action: 129 more days over 35°C
- Existing action: 92 more days over 35°C
- Necessary action: 66 more days over 35°C
Solutions to reducing heat impact
We need to understand we can’t reverse global temperature rise, but we can potentially slow it over the long term. So mitigation and adaptive strategies are both important. These strategies are both personal and societal.
Personal behaviour change
Adaptive behaviour can reduce personal heat health risk of heat exhaustion and mortality. We have prepared an Essential Heatwave Preparedness Tips for Merribek Households. Stay cool, look after your heat Health. Remember Fossil Fuels are worsening Extreme Heat. We saw a decline in heat related excess deaths between the 2009 and 2014 heatwaves and this has been attributed, at least in part, to the heat health warnings implemented after 2009 and adaptive personal behavior. Note the increase in after hours Doctor consultations and ambulance dispatches, while excess deaths decreased.

State and Local Government Changes to Infrastructure
To reduce the Urban heat effect to make our suburbs cooler we need a range of adaptive strategies implemented at the State Government and Local Council level. This includes UHI Mitigation Strategies (and these are ranked by the Low Carbon Living CRC in the Urban Heat Island Mitigation Performance Index):
- Cool and Permeable Pavements
- Street Trees and Planting
- Water Features and Evaporative Cooling
- Green Open Spaces
- Public Space Shading Structures
- Education Initiatives and Campaigns
- Cool Roofs
- Shading Devices
- Built Form and Design
- WSUD – Water Sensitive Urban Design
- Cool Facades
- Provision of Refuges
- Green Roofs
- Vertical Greenery
- Anthropogenic Heat Reduction
- Street Orientation
- Provision of Incentives
Merri-bek Council has already been doing some of these positive strategies, particularly street tree planting, public space shading structures such as shade sails at playgrounds, cool pavements, and changing streetscape with raingardens, tree plantings as part of WSUD, like in Carlisle street Coburg recently.

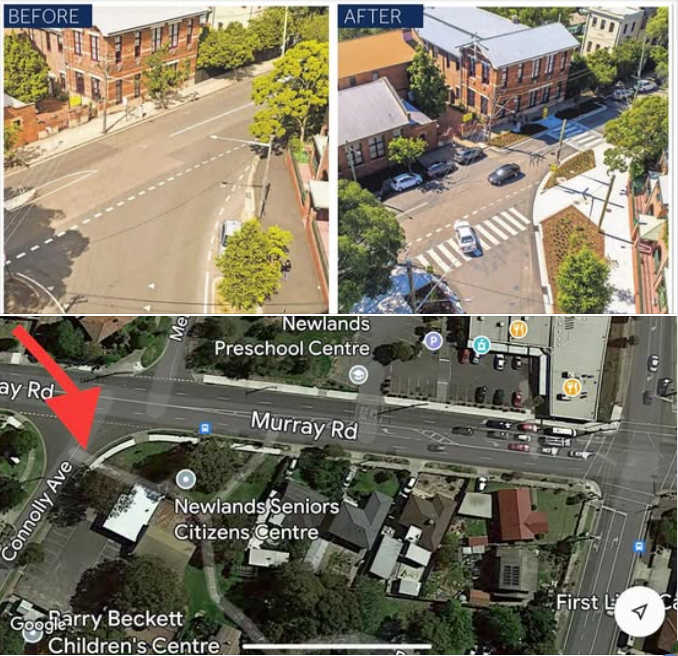
Changing roads is more difficult, but often should be done to increase space for active transport, add more trees and vegetation, and to reduce vehicle accidents and increase safety for pedestrians and cyclists. The Connolly Avenue intersection with Murray Road in Coburg is a good case in point.
“The dangerously wide splay at Connolly reduces visibility for both vulnerable road users and drivers. There have been many crashes plus two Coburg High students have been hit on bikes on the footpath. Last year a driver took this corner from Murray to Connolly way too fast and smashed into cars outside Barry Beckett. One car had a child in it. While Murray Rd is a State arterial road, this Connolly Ave intersection is Merri-bek City Council responsibility.” – Facebook Post by Safer Walking and Riding for Murray Rd 24 January 2025
We made several recommendations to the State Government Addressing urban heat, heatwave and heat health risks in our submission to the State Government Inquiry into Climate Resilience in July 2024.
Federal Government national mitigation policies
At the national level we need the Federal Government to better regulate emissions across all sectors, address national infrastructure and international climate policy by:
- Stop fossil fuel approvals for new coal and gas projects, (Still making things worse)
- Establish a plan for phaseout of existing coal and gas, (Not in Frame)
- Phaseout fossil fuel subsidies, (Baby Steps)
- Tackle poor reporting and regulation of methane emissions (Baby Steps)
- Increase renewables & storage, restructure energy grid (Major focus)
- Restructure transport systems to reduce transport emissions for vehicle electrification, greater reliance on public transport and active transport, (Baby steps)
- Introduce demand management of jet aviation emissions (Not in Frame)
- Be ambituous at international climate negotiations (Positive movement)
Our assessment of current Federal Government is in brackets.
References:
Bureau of Meteorology, Time series Graphs for Victoria in February http://www.bom.gov.au/cgi-bin/climate/change/timeseries.cgi?graph=tmin&area=vic&season=02&ave_yr=T&ave_period=6190
Bureau of Meteorology, Time series for Summer for Melbourne (Olympic Park) site 086338 http://www.bom.gov.au/cgi-bin/climate/hqsites/site_data.cgi?variable=minT&area=aus&station=086338&dtype=anom&period=summer&ave_yr=T
The Bureau of Meteorology has a trend map for hot days and hot nights, but difficult to get public data for specific location http://www.bom.gov.au/cgi-bin/climate/change/extremes/trendmaps.cgi?map=TNmx&period=1980
The Climate Council in early 2024 produced a heat map tool for Australia showing hot days and hot nights for each suburb and projections for these extremes based on climate mitigation pathways. You can try it yourself… https://www.climatecouncil.org.au/resources/heatmap/
Melbourne University, 29 April 2024, These maps tell us we need to cool our sweltering streets, https://pursuit.unimelb.edu.au/articles/these-maps-tell-us-we-need-to-cool-our-sweltering-streets
Low Carbon Living CRC, Urban Heat Island Mitigation Performance Index, http://uhimitigationindex.fbe.unsw.edu.au/mitigation/index.html
Victorian Planning Department, Cooling and Greening Melbourne Interactive Map https://mapshare.vic.gov.au/coolinggreening/
